


How player props became the most data-driven market on the NHL board
Three seasons ago a UK bookie still priced anytime goalscorer odds on the back of last week’s box score and a vague sense of who was hot. Today, the same market reprices three times before the morning skate, twice more after the pre-game warm-up, and once again the moment the starting goalie is confirmed. The change isn’t a market mood — it’s an infrastructure shift, and most UK punters are still betting NHL player props as if it hadn’t happened.
An NHL player prop is a wager on an individual player’s performance in a single game: did the player score a goal at any point, how many shots on goal did they record, how many points (goals plus assists) did they total, how many saves did the goalie make, and so on. These markets used to be a sleepy corner of the sportsbook board. Then NHL EDGE — the league’s hardware-tracked statistical infrastructure — rolled out to every arena, and the pricing model that bookmakers use to set prop lines fundamentally changed.
The result is a market where the public-facing data has caught up to the bookmaker’s modelling in a way that gives an informed punter genuine tools. Anyone who’s prepared to read shot-quality numbers, time-on-ice projections and line-combination shifts has a real shot at finding value before the closing price tightens. Anyone who clicks a famous name at the published price without checking is donating to the sportsbook’s quarterly figures.
The rest of this guide breaks down the prop categories, the EDGE data behind them, the research routine that produces stake-worthy tickets, the time-zone problem that UK punters face on late lines, and the three mistakes that I see repeated in reader emails week after week.
The five prop categories UK books offer on the NHL
The prop tree on a major UK sportsbook lists somewhere between 30 and 80 markets per NHL game, but the count is misleading — those markets cluster into five core categories, and everything else is a variant or combination. Knowing the five categories is the difference between scanning a board and reading it.
The first category is anytime goalscorer. The bet asks a binary question: does the named player score at least one goal in the game, including overtime but typically excluding the shootout. Prices range from around +110 on first-line forwards on heavy favourites to +800 or longer on bottom-six skaters. The pricing model factors in shooting percentage trend, time-on-ice projection, opponent goalie matchup, and recent shot-volume data. Anytime goalscorer is the single most-played prop on UK books and probably the single most-overpaid by casual punters.

The second category is shots on goal. The bet sets an over/under line — typically 2.5 or 3.5 SOG for a regular forward, 4.5 or 5.5 for a high-volume shooter, occasionally 6.5 on Auston Matthews-tier shooters in pace-up matchups. Pricing on SOG props is usually -110 on each side around the line, with vig running 8 to 12 percent. SOG props move significantly when EDGE shot-speed data leaks into bookmaker models, because high-speed shooters generate more total attempts in fewer minutes.
The third category is points totals — goals plus assists for the player. Typical lines are 0.5 points for fourth-liners, 1.5 for top-six forwards, 2.5 for elite players in matchup-up spots. Points lines correlate with team total markets — a forward on a team projected for 3.5 goals carries higher points equity than the same forward on a team projected for 2.5. The correlation is something the bookmaker handles competently but the public underprices.
The fourth category is assists only — typically 0.5 assists on top-six players. Smaller market, thinner depth, less efficient pricing on books that bother to carry it. The bookmaker model on assists is rougher than the model on goals because assist credit is more circumstantial — a deflected shot off a defenceman counts the same as a clean breakaway pass — and the noise is greater.
The fifth category is goalie props — saves over/under, save percentage props on a handful of books, and shutout props (binary, will the goalie record a shutout). Goalie props are the most pace-sensitive market on the board, because save volume depends on the opponent’s shot generation, which depends on pace, which depends on style matchups. The bookmaker model on goalie saves is strong, but the conditional probability changes a lot in the 30 minutes before puck drop based on confirmed starters on both sides.
Specialist props — period-by-period goalscorer, first goal scorer, head-to-head matchup props, hat-trick markets — exist on most UK books but with thin limits and wider vig. They’re occasional opportunity markets rather than core repertoire.
NHL EDGE: the league-grade tracking that quietly reprices props
NHL EDGE is the technical reason your prop prices look different in 2026 from how they looked in 2023, and the explanation matters because the same data that’s repriced the bookmaker’s model is the data you can use to read the new prices.
EDGE is the league’s positional and biometric tracking system, deployed across all 32 NHL arenas through a network of infrared cameras and player and puck sensors. The system tracks millions of data points per season, including shot speed, skating speed, distance covered, zonal time, and dozens of other metrics that flow into a public-facing analytics product alongside the proprietary feeds that licensees — including bookmakers — receive. Tage Thompson posted the season’s top shot speed in 2024–25 at 106.00 mph for Buffalo, a number that’s now part of the publicly available record and feeds directly into shots-on-goal modelling. Connor McDavid recorded 18 separate skating bursts above 22 mph in the opening period of EDGE measurements for the 2025–26 season, a leaderboard number that flows into expected-shot-generation models.
Russell Levine, the NHL’s VP of Statistics and Information, framed the project this way: The goal with NHL EDGE is to take these data points and turn them into statistics that can teach fans something new about the game. What’s interesting about that framing for a punter is the inverse — every fan-facing statistic also lands in the modelling pipeline that prices a prop tree. The data that teaches the fan something new also teaches the bookmaker something new, and the prop line is the visible output of that learning.
The practical implications for prop pricing fall into three buckets. Shot-speed data refines anytime goalscorer pricing on players whose top speed has shifted year-over-year, because faster shots generate more dangerous chances and higher conversion rates. Skating-speed bursts refine SOG modelling, because high-burst skaters generate more rush chances and more shots from prime areas. Zonal-time data refines point-totals modelling, because forwards who spend more attacking-zone time generate more shot-attempt and assist opportunities per minute.

Where EDGE doesn’t help — yet — is in goalie modelling on the puck-tracking side. The league has rolled out limited public goalie metrics, but the depth of the public data on save quality, rebound control and lateral movement still lags the depth on skaters. Bookmaker models on goalie props are sophisticated, but the bookmaker’s data advantage over the public is bigger here than in any other category.
Why props are priced more conservatively than game lines
Vig on a standard NHL moneyline runs 4 to 6 percent. Vig on a typical SOG prop runs 8 to 12. Vig on a niche anytime goalscorer prop on a long-shot player can run 18 to 22. The difference isn’t accidental. Props are priced more conservatively than game lines for three structural reasons that every UK punter needs to understand before treating them as equivalent equity opportunities.
The first reason is liquidity. A moneyline on a marquee NHL game might absorb six-figure stakes across a major UK book without moving meaningfully. The same book’s SOG line on a second-line winger might absorb four-figure stakes before the trader pulls or moves the market. Thin liquidity means the bookmaker has to price wider to defend against a small number of sharp tickets — the vig is a buffer, not greed.
The second reason is model uncertainty. The bookmaker’s moneyline model is built on decades of game-result data, and the prediction error on a single moneyline is well-characterised. The prop model is newer, narrower, and substantially noisier — individual-player variance is wider than team variance, and conditional probabilities depend on dozens of inputs the model can’t always observe (line-combination changes, in-game injuries, coaching adjustments). Wider error margin demands wider vig to keep the book solvent.
The third reason is correlation risk. A book that takes a heavy ticket on a single moneyline can hedge across the rest of the day’s slate. A book that takes a cluster of correlated prop tickets — anytime goalscorer on three top-line forwards from the same team — faces concentrated exposure that’s hard to lay off. Correlation premium gets priced into the prop tree as wider vig and lower limits.
The strategic consequence for a UK punter is that prop edges need to be bigger than moneyline edges to be worth playing. A 2 percent edge on a moneyline is a real ticket; the same 2 percent edge on a prop is inside the vig and probably noise. Sharpen the threshold to 4 to 5 percent of true probability over implied, and the prop tree opens up properly. Below that threshold, you’re funding the bookmaker’s correlation hedge.
This also explains why prop accumulators are the worst-priced product on the entire UK board. A three-leg parlay of NHL props at 10 percent vig per leg has a compound bookmaker margin of roughly 27 percent. That’s the cost of admission before the model even speaks. I do not play prop parlays. I have not played them in nine years. They are the most expensive form of optimism in the sports betting universe.
Goalie props: saves, save percentage, shutout markets
Goalie props look like a relatively clean betting market on first read and become substantially more complicated the longer you look at them. The setup is straightforward: the book publishes an over/under on the goalie’s total saves for the game — typically 27.5 to 32.5 for a starting goalie depending on opponent — and you take a side at -110 each way.
What complicates the picture is the dual dependency on pace. Goalie saves are a product of opposing shot generation, which depends on opposing team pace, which depends on game state, which depends on early-period goals. A line set at 28.5 saves on an evenly-matched game can blow past 35 saves if the goalie’s team takes an early two-goal lead and then sits back; the same line can settle at 22 saves if the goalie’s team controls play and limits the opposing shot-attempt rate.
The pricing model accounts for these conditions in advance, but the public doesn’t always read them right. A goalie projected for a 30-save game on a high-pace expected matchup but priced at 27.5 over is a value play when the implied probability of clearing 27.5 (typically around 52 percent) sits well below your conditional estimate.
The other goalie market that deserves attention is the shutout prop. Asking whether a goalie records a shutout is a binary question, typically priced between +600 and +1100 depending on goalie quality and opponent strength. The implied probability sits in the 8 to 14 percent range. Actual shutout rates across an NHL season are around 7 to 9 percent on a per-game basis, with significant variance by goalie. Elite goalies (.920+ save percentage) post shutouts at 11 to 14 percent rates against weak offences; average goalies (.905 save percentage) post them at 5 to 7 percent rates. The market often prices elite goalies competitively but mispriced average goalies against poor offences in low-total environments.

NHL team sponsorship revenue reached $1.53 billion in 2024–25, a 9 percent year-on-year increase, and a meaningful slice of that money funds the data-broadcast partnerships that surface goalie performance metrics in real time. That underlying funding is part of why the goalie data ecosystem has matured faster than other player-tracking layers — sponsors want quantified performance to brand against, which means the public has access to more save-quality numbers than it did five years ago. The bookmaker has more too. The public-private gap on goalie props is narrower than on any other prop category, which makes it harder to find edges and also more honest pricing on the edges you do find.
A research routine that takes 12 minutes per ticket
Prop tickets that survive long-term aren’t built on hot takes; they’re built on a repeatable routine that you run before every stake. Mine takes 12 minutes per ticket and produces either a clear green light or a clear walk-away on roughly 80 percent of opportunities. The rest get a yellow flag and a second look later.
Minute one and two: confirm time on ice projection. The single most underrated input in prop modelling is how many minutes the player is expected to be on the ice. A top-six forward averaging 19 minutes per game has materially different prop equity from one averaging 16 minutes, and line-combination changes from the last game shift TOI projections by 1 to 4 minutes routinely. Open the team’s most recent practice-line report, then check the projected line combinations on the league’s official site.
Minute three and four: check power-play unit composition. Power-play time is the highest-equity ice time for shot-generation and points modelling. A player who’s been on the second power-play unit and gets promoted to the first by injury or coaching decision sees their prop equity jump 15 to 25 percent in a single shift. Confirm the PP1 and PP2 units against the most recent game.
Minute five and six: read recent shot-volume trend. Open the player’s last five games on the league site and read SOG. A player trending up — 3, 4, 5, 6, 7 SOG across five games — is on a different equity curve from one trending flat or down. Recency matters more than season average on prop lines because the bookmaker model is partly recency-weighted and the public partly isn’t.
Minute seven and eight: opponent goalie matchup. Confirm the projected starting goalie for the opposing team. A high-percentage starter compresses anytime goalscorer probability meaningfully; a confirmed backup expands it. Save percentage from the last five games of the opposing goalie is the cleanest single number to read.
Minute nine and ten: EDGE leaderboard scan. Check the player’s recent shot speed and skating speed numbers if available. A player whose shot speed has trended up over the last six measured games is generating more dangerous chances. A player whose burst-speed count has dropped is potentially fatigued or playing through something. The EDGE numbers aren’t real-time, but they’re current enough to flag obvious shifts.
Minute eleven and twelve: cross-check pricing across two UK books. The same SOG line of 2.5 might be priced at -125 over on one book and -110 over on another. Two-book scan is the difference between paying full vig and getting a competitive number.

If all six checks come up green and the math gives an edge over implied probability, the ticket gets staked. If any one of the six comes up red, the ticket gets walked.
Props and the UK time-zone problem
Most NHL prop lines tighten substantially in the 60 minutes before puck drop, which on a typical Eastern-time NHL game means 23:00 to 00:00 BST. By 00:00 BST, the same prop you considered at lunchtime has often moved by 8 to 15 cents — sometimes more on confirmed-goalie news. UK punters who stake their props in the morning are systematically buying yesterday’s price.
The structural fix is to delay the stake until at least 23:30 BST, when starting goalies on both sides are usually confirmed and line combinations from morning skate have firmed up. That delay costs about an hour of sleep, but it earns about 1 to 2 percent of edge on average across a season of regular play.
The deeper problem is that some UK books pull their prop trees or freeze their prop lines after 22:00 BST on weekdays, which means the late-update advantage isn’t available on every book. A book that maintains its prop tree through 00:30 BST is genuinely worth more to a serious prop punter than a book that closes its tree at 21:45. That’s not a marketing claim from the book; it’s a measurable workflow advantage.
The compromise I run on most weeknights is to scan the prop tree at 21:00 BST for any markets that are obviously mispriced relative to my model, stake those at the early price (accepting that the market hasn’t fully formed), and then run the 12-minute routine on shortlisted props between 23:00 and 23:45 BST. By 23:50 I’ve either staked or walked, and by midnight I’m watching the game with the rest of the work already done.

EIHL props: scarce, but they exist
The EIHL prop tree is exactly what you’d expect on a league without a hardware-tracking system or the broadcast funding to support deep modelling. On most UK books, EIHL props exist for two markets only — anytime goalscorer on top-line forwards (Sheffield, Belfast, Nottingham almost exclusively), and occasional team total goals on the same teams. Stake limits are low, vig is wider than on NHL equivalents, and the markets vanish entirely on non-derby weeknight fixtures.
That said, the prop edges on EIHL anytime goalscorer markets can be meaningful because the bookmaker model is shallower than its NHL counterpart. A confirmed top-line winger on Sheffield against a known weak goalie at home is a setup the bookmaker doesn’t always price tightly, and the implied probability can sit 4 to 6 percent below your conditional estimate even before factoring in home crowd effects. The constraint is stake limit — most UK books cap EIHL prop stakes at £25 to £75, which means scaling the edge across a season is hard.
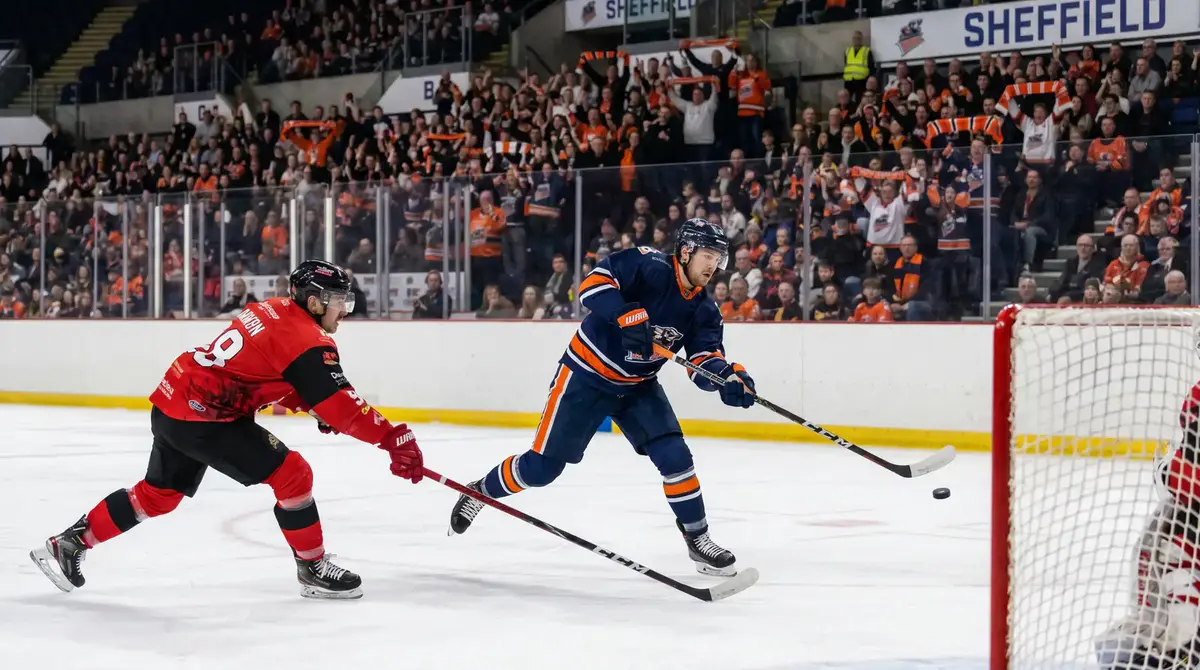
If you’re going to play EIHL props at all, treat them as opportunistic supplements to your NHL prop volume rather than a core market. The infrastructure to run a sustainable prop strategy on the EIHL doesn’t exist yet, and the bookmaker is correctly cautious about pricing depth on a league it can’t model with confidence.
Three prop mistakes UK punters keep making
Three errors come up in reader emails and in conversations with friends who bet recreationally often enough that they deserve a section to themselves. Catching these errors is worth more than reading any single market analysis.
The first mistake is parlaying props from the same line combination without considering correlation. Backing anytime goalscorer on three forwards from the same line is not three independent bets — those players share ice time, shot generation, and game state. If one scores, the conditional probability the other two also score is meaningfully higher than the bookmaker’s parlay math implies, but in the opposite direction: the parlay still loses if any of the three blanks. The correlation cuts your equity, not the book’s.
The second mistake is overweighting famous-name props. The market on Connor McDavid anytime goalscorer is the most efficiently priced prop on the entire NHL board, because every modelling resource has been thrown at it. Backing McDavid at +135 expecting an edge is almost always a flat-priced ticket — sometimes a touch favourable, sometimes a touch unfavourable, but almost never a meaningful edge. The recoverable edges live on second-line forwards whose pricing models are shallower.
The third mistake is reading “hot streak” pricing without checking opponent and matchup context. A player who’s scored in four straight games is not 40 percent likely to score in the fifth — they’re whatever the conditional probability says they are given the opponent goalie, line combination, and pace expectation. The hot-streak narrative is what makes the public price soft on the over and tight on the under, which is exactly the kind of inefficiency the EDGE-driven bookmaker model exploits in the other direction.
For a deep dive on reading EDGE stats specifically for prop betting, including the public-data sources and how to map them to bookmaker pricing models, see our NHL EDGE stats for betting walkthrough.
Common questions about NHL player props
Three questions come up across reader correspondence often enough to deserve direct, working-honest answers.
Reading the prop tree like a data person, not a fan
Player props are the part of the NHL board that rewards careful reading and punishes lazy reading more decisively than any other market. The EDGE data is now embedded in the bookmaker model deeply enough that a casual punter clicking a famous name at the displayed price is, on average, donating expected value to the book. The same data is available to the public — sometimes lagged, sometimes real-time — and the punter who reads it carefully has tools that didn’t exist five years ago.
What I try to do, every prop ticket, is treat the market like a small modelling problem rather than a fan-engagement product. Confirm TOI. Read the power play. Check the goalie. Look at the speed leaderboard. Compare across two books. Decide on edge against implied. Stake if green, walk if anything is red. That’s it. No hot picks, no narrative chasing, no famous-name premiums. Twelve minutes per ticket, repeated steadily across a season, with prop parlays left strictly off the menu.
Hockey props in 2026 are a data market. Read them like one.
Articles
Prepared by the hockeybetonline.com editorial staff.
