

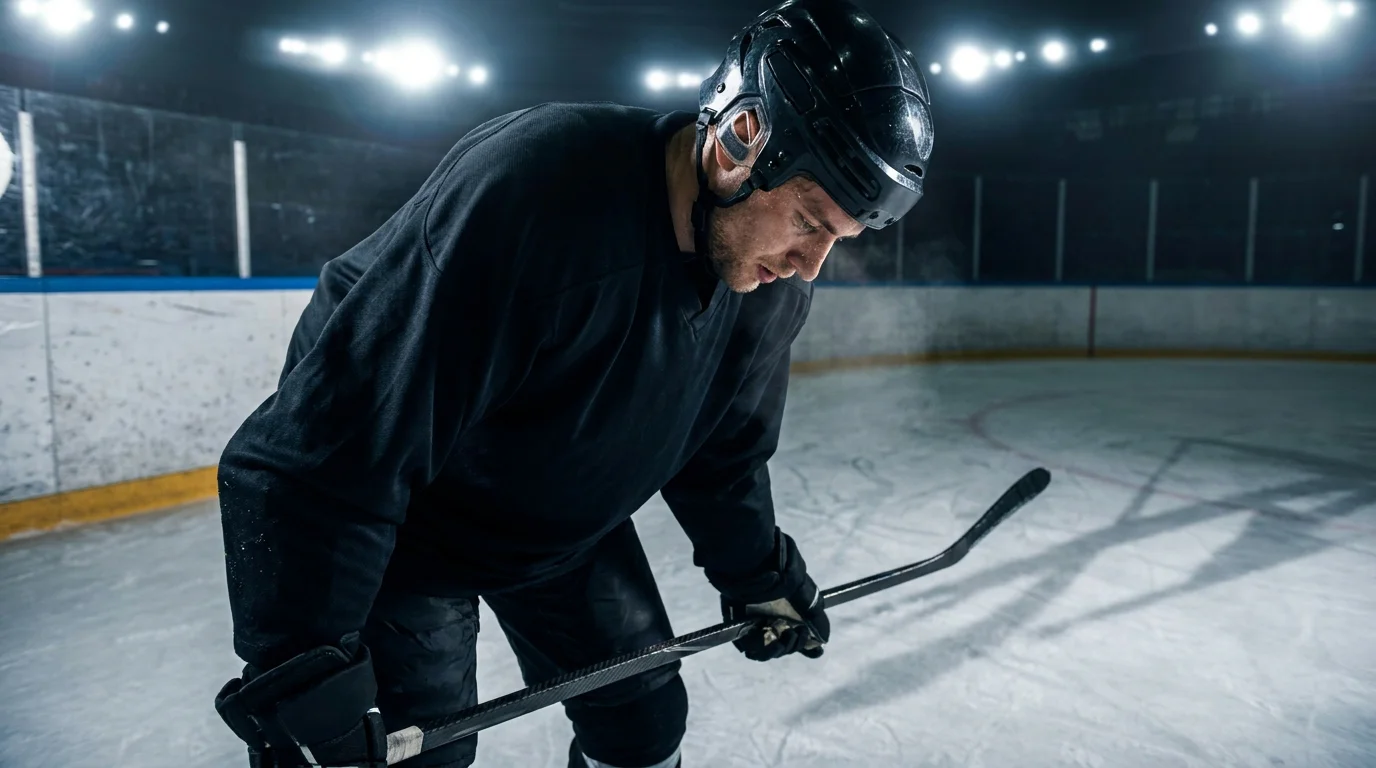
Why the second night of a back-to-back is a different team
Three Februarys ago I tracked every NHL team’s win rate on the second night of a back-to-back across the full season. The aggregate was 41% against an all-game baseline of 50%. That nine-percentage-point gap is what gets called “fatigue” in the post-game interviews, but it’s much more specific than that. It’s a quantifiable structural disadvantage that shows up on the same teams over the same schedule windows year after year, and most UK punters don’t price it properly.
Back-to-back NHL betting is the practice of identifying games where one or both teams played the previous night, and treating the rest differential as a betting input. NHL teams play roughly 14 to 18 back-to-back sets per season. The league average win rate for the team on the second leg is around 43 to 45% across the full season, which translates to a 5 to 7 percentage point disadvantage compared to fully rested teams. That gap is the edge sitting in plain sight.
The reason this edge persists is that books partially price it but recreational money doesn’t fully respect it. The book moves the line by maybe 8 to 12 pips on the rested team’s moneyline, but the structural disadvantage is closer to 18 to 22 pips. The remaining gap is the value you can collect by paying attention to schedule alone, before any other handicapping work.
What the data actually shows
The NHL’s 82-game schedule packs roughly 14 to 18 back-to-back sets into every team’s season. The exact number depends on the team’s travel obligations and the league’s scheduling priorities, but it’s a structural feature of every roster’s calendar. By season’s end, every team has played a meaningful sample of B2B second-leg games, and the patterns are stable.
Win rate on the second night sits between 38% and 48% depending on the team. Deep rosters with high-end backup goalies — Florida, Vegas, Boston in recent seasons — hold close to 48%. Thinner rosters with shaky backup goalies — typical bottom-half teams — fall to 38% or lower. The team-by-team variance is meaningful, and the best practical use of the B2B data is to identify which teams travel and rest particularly badly.

Goal differential on the second leg averages -0.4 per game across the league. That is, on average, a second-leg team scores 0.4 fewer goals than they would otherwise be expected to and concedes 0.4 more. The combined gap of 0.8 goals per game is the single largest schedule-based handicapping factor in NHL betting.
The NHL operates at a $6.5 billion revenue level in 2024-25, and that scale supports an 82-game regular season schedule that simply has to include B2B sets because of arena availability and travel logistics. The league has reduced B2B frequency over the past five years, but it remains an unavoidable scheduling reality. The disadvantage isn’t going away.
The travel factor that compounds the fatigue
Travel between the first and second game amplifies the B2B disadvantage. A team that plays in Boston on Tuesday and Toronto on Wednesday has a short flight and one time zone shift. A team that plays in Los Angeles on Tuesday and Tampa Bay on Wednesday has a five-hour flight, three time zones, and a 4 a.m. local arrival time.

The cross-country B2B is the most punishing configuration. Teams flying west-to-east on a B2B second leg post a roughly 36% win rate, the worst of any travel pattern. The combined impact of jet lag, sleep deprivation and physical fatigue produces a measurable gap from the average B2B disadvantage.
The opposite pattern — east-to-west — is less brutal but still meaningful. A team flying from Florida to Vegas on a B2B second leg posts roughly a 42% win rate. The gap from the league average is smaller because the body clock adjustment from going west is easier than from going east.
The other travel factor is altitude. Colorado at home is the only major-altitude NHL venue, and visiting teams on the second leg of a B2B at the Mile High City underperform their normal B2B baseline by another 3 to 5 percentage points. The cumulative disadvantage of B2B plus altitude is one of the strongest single configurations in the league for backing the home side.
The goalie choice that decides which game is which
Almost every NHL coach plays the backup in one half of a B2B set. The pattern is asymmetric — about 70% of B2B sets see the backup start the second game — but the choice depends on opponent, travel and recent starter usage.
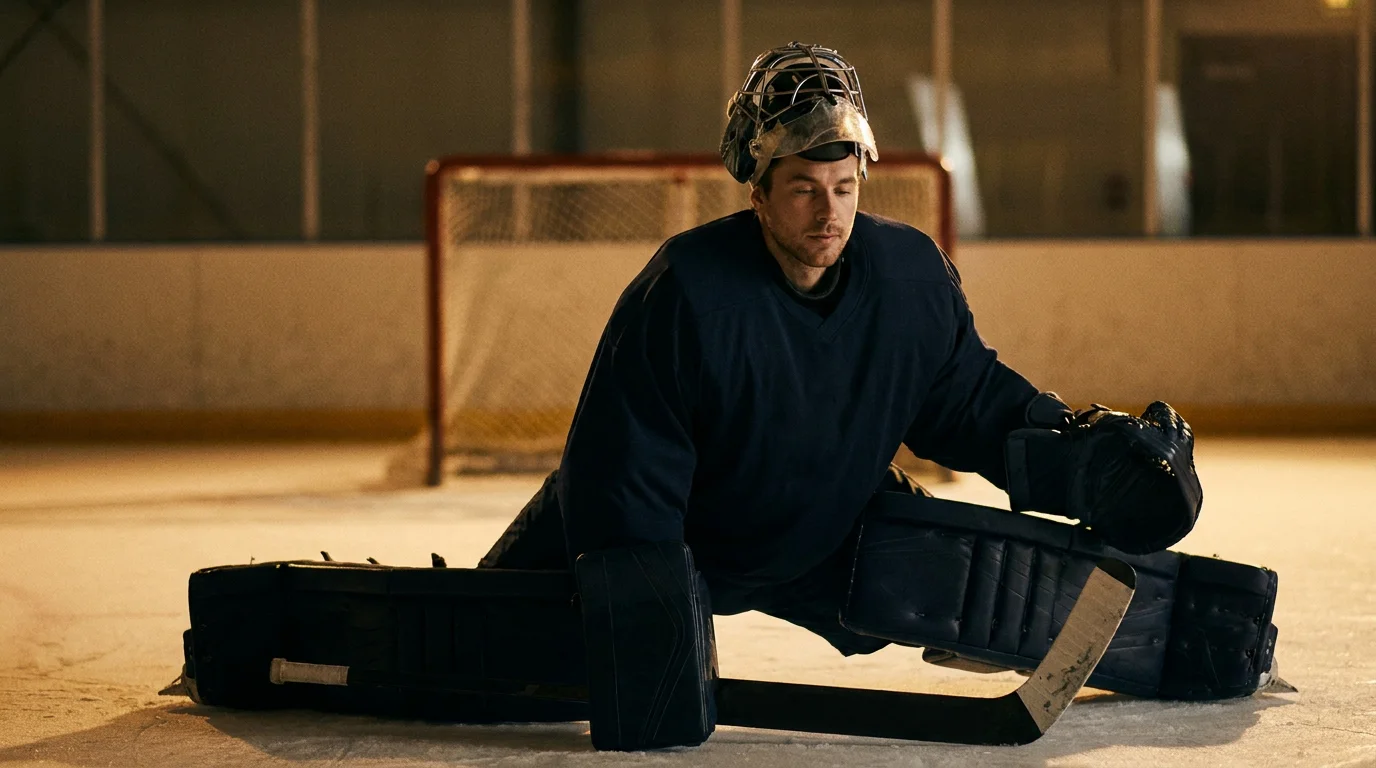
The configuration to watch: a B2B where the team plays the starter in the first game and the backup in the second, and the second game is against a rested opponent starting their primary goalie. This is the classic “double disadvantage” B2B spot — second leg, tired team, backup goalie versus rested starter — and the moneyline on the rested side is consistently better than the line should be.
The opposite configuration is the team that plays the backup in the first game and the starter in the second. This is rarer but it happens, usually when the second game is against a marquee opponent. In this case, the B2B disadvantage is partially offset by the starter being fresher than their usual workload, and the rest disadvantage shrinks.
I track which teams use which pattern through the season. The mid-season trade deadline shuffles personnel and the goalie patterns reset. The new pattern usually emerges in 10 to 15 games and holds steady through the rest of the season.
The betting angles worth running
The cleanest angle is backing the rested underdog against the B2B favourite. When a team on the second leg is still listed as the favourite — which happens when the team is meaningfully better on paper than the opponent — the price doesn’t fully absorb the fatigue. The underdog moneyline carries a structural edge.
The example to keep in mind: a team posted at 1.65 on the road, fresh, against a home team on the second leg of a B2B. The road price implies 60% win probability. The home team’s B2B-adjusted true probability is closer to 42 to 45%, which leaves the road side implied at 55 to 58%. The price is wrong, in your favour, by 2 to 5 percentage points.
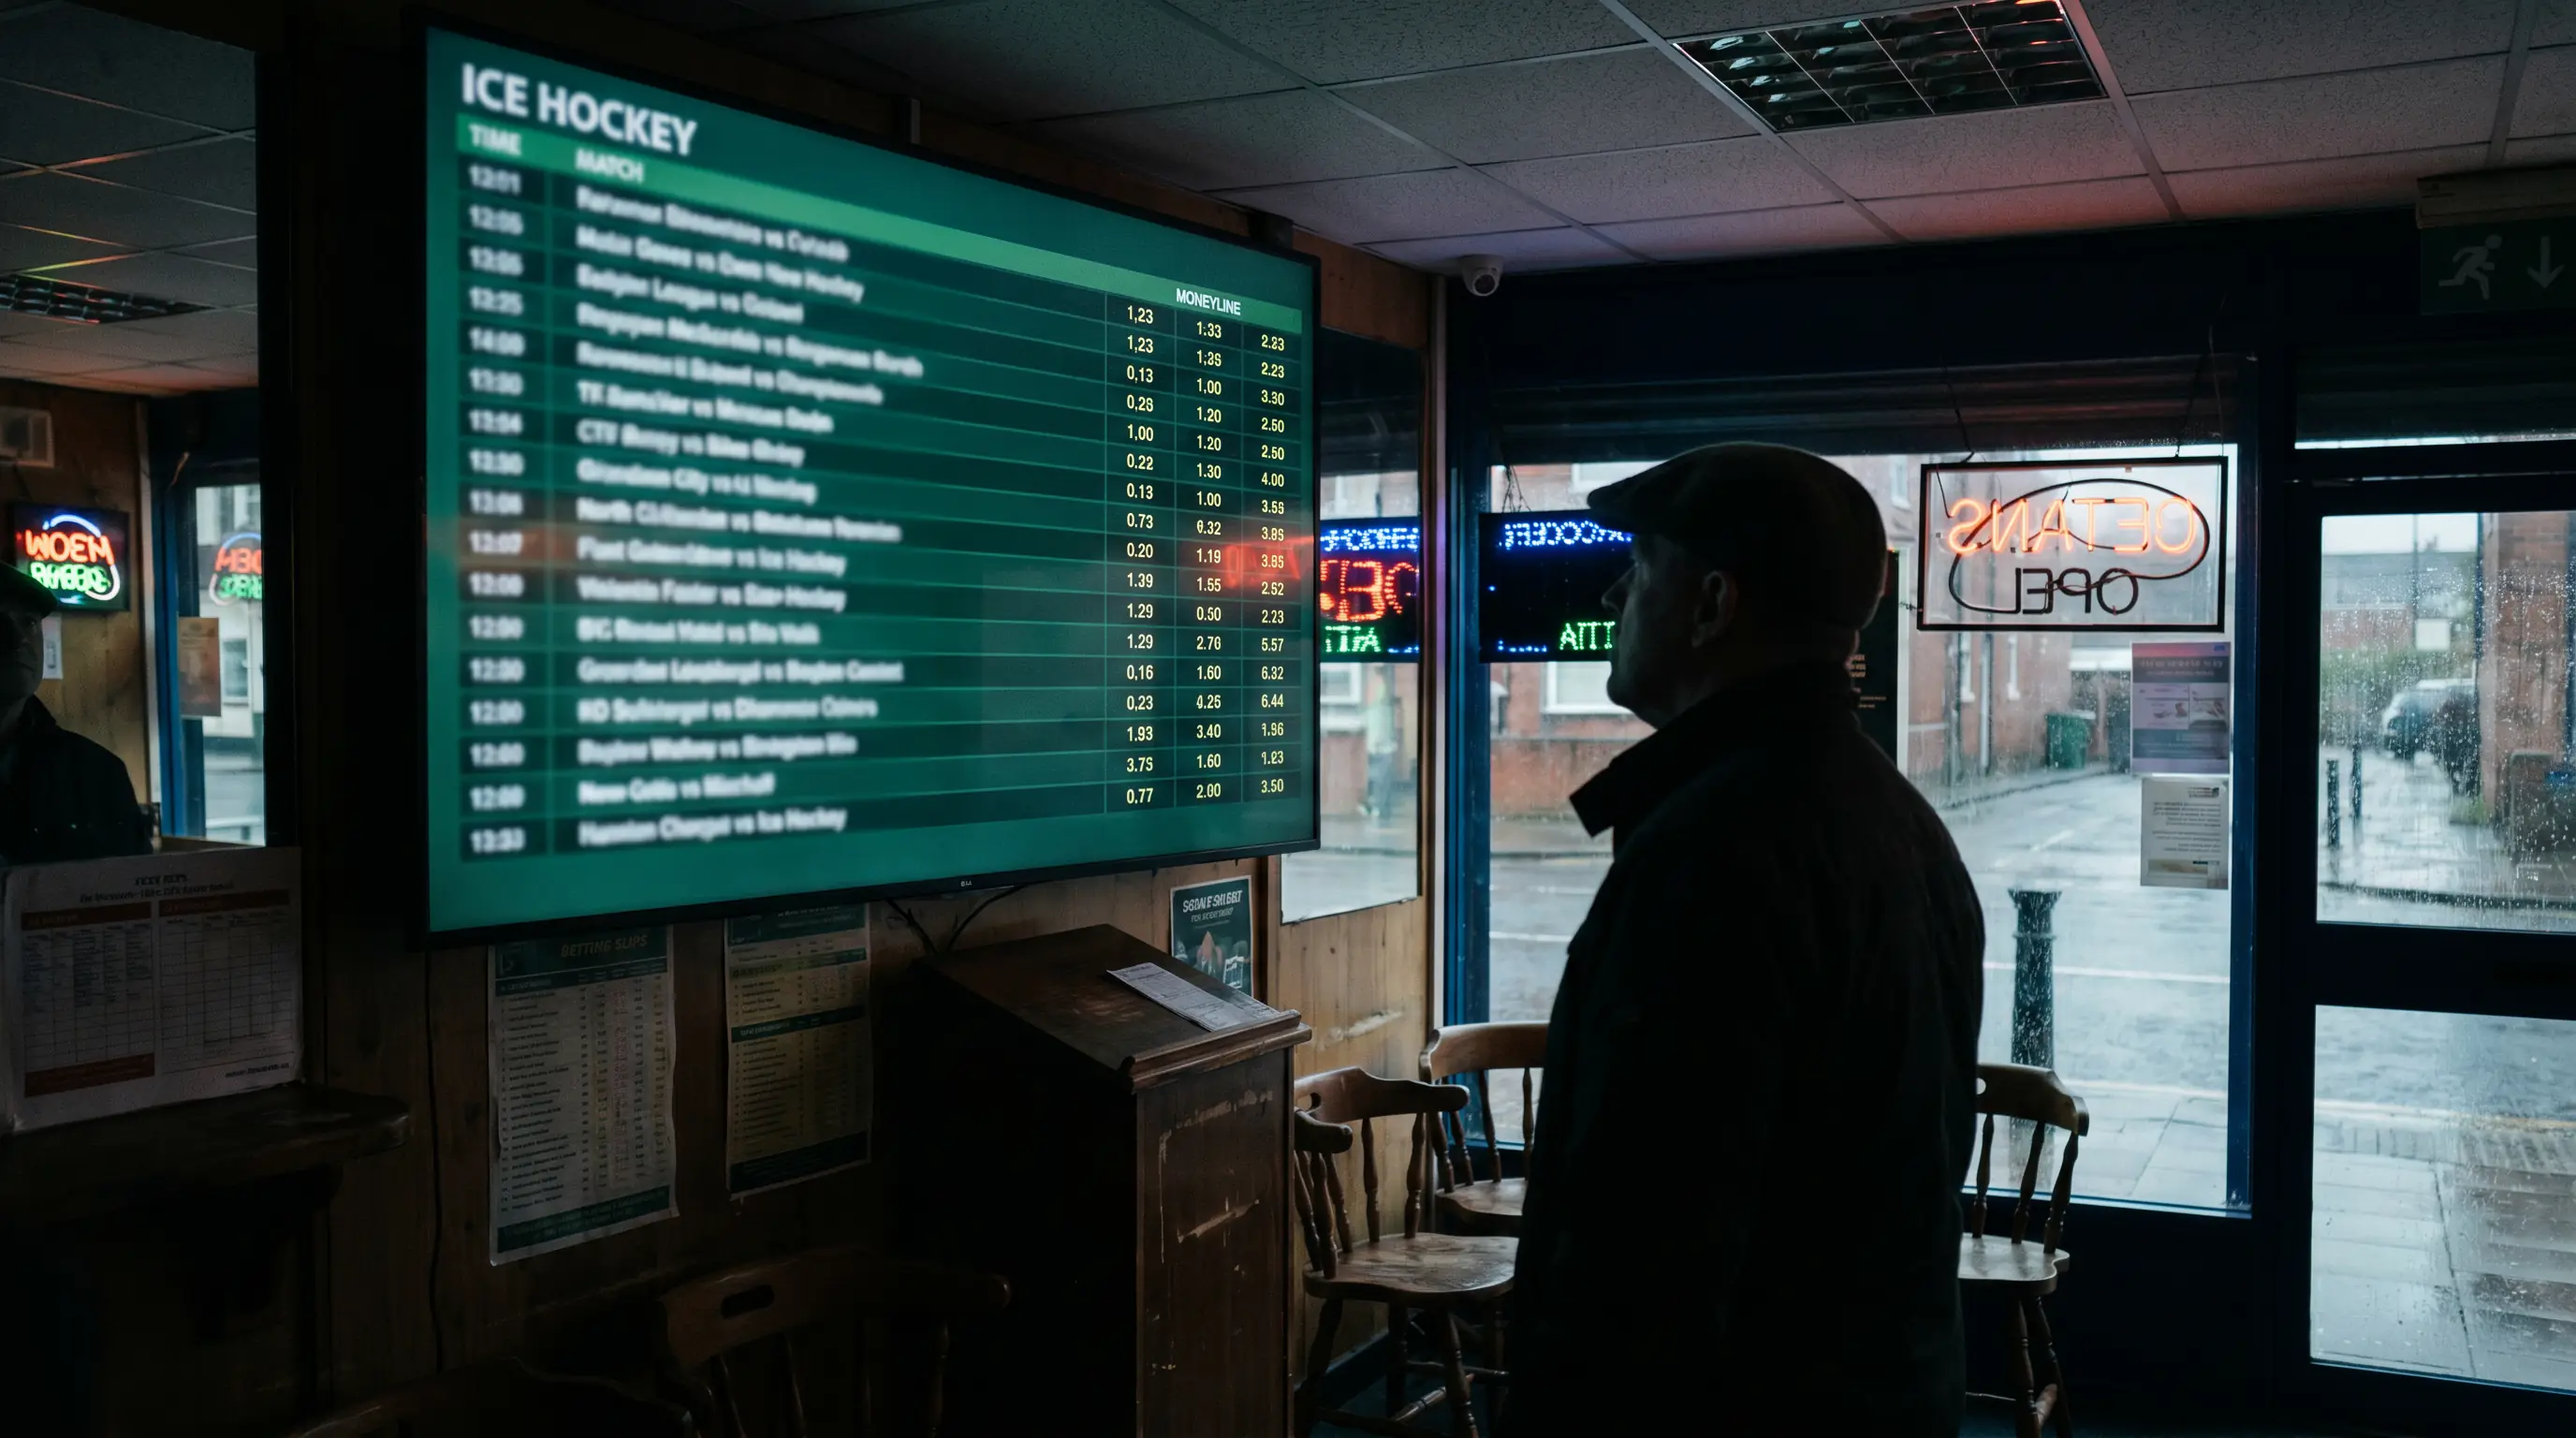
The other angle is the under on B2B second-leg totals. A team that’s tired plays slower hockey, takes fewer shots and concedes more rebounds on shots they do face. The combined effect on totals is roughly -0.3 goals per game. UK books typically only adjust the total by -0.1 or -0.15 on B2B second legs, leaving a structural lean to the under.
The 22.9 million tickets sold across the 2023-24 NHL regular season at 96.2% capacity tells you the league is selling tickets to fans who care about specific matchups regardless of fatigue, which is why arena conditions amplify the B2B effect — fatigued teams in front of hostile crowds underperform their already-reduced baselines.
The EIHL question and how UK punters can use this
The EIHL plays a different schedule. The league runs roughly two games per weekend per team — typically Saturday and Sunday — and most of those weekends are B2Bs. The B2B effect on EIHL win rates is smaller than NHL B2B effects because the league is built around the weekend doubleheader and the rosters are constructed for it.
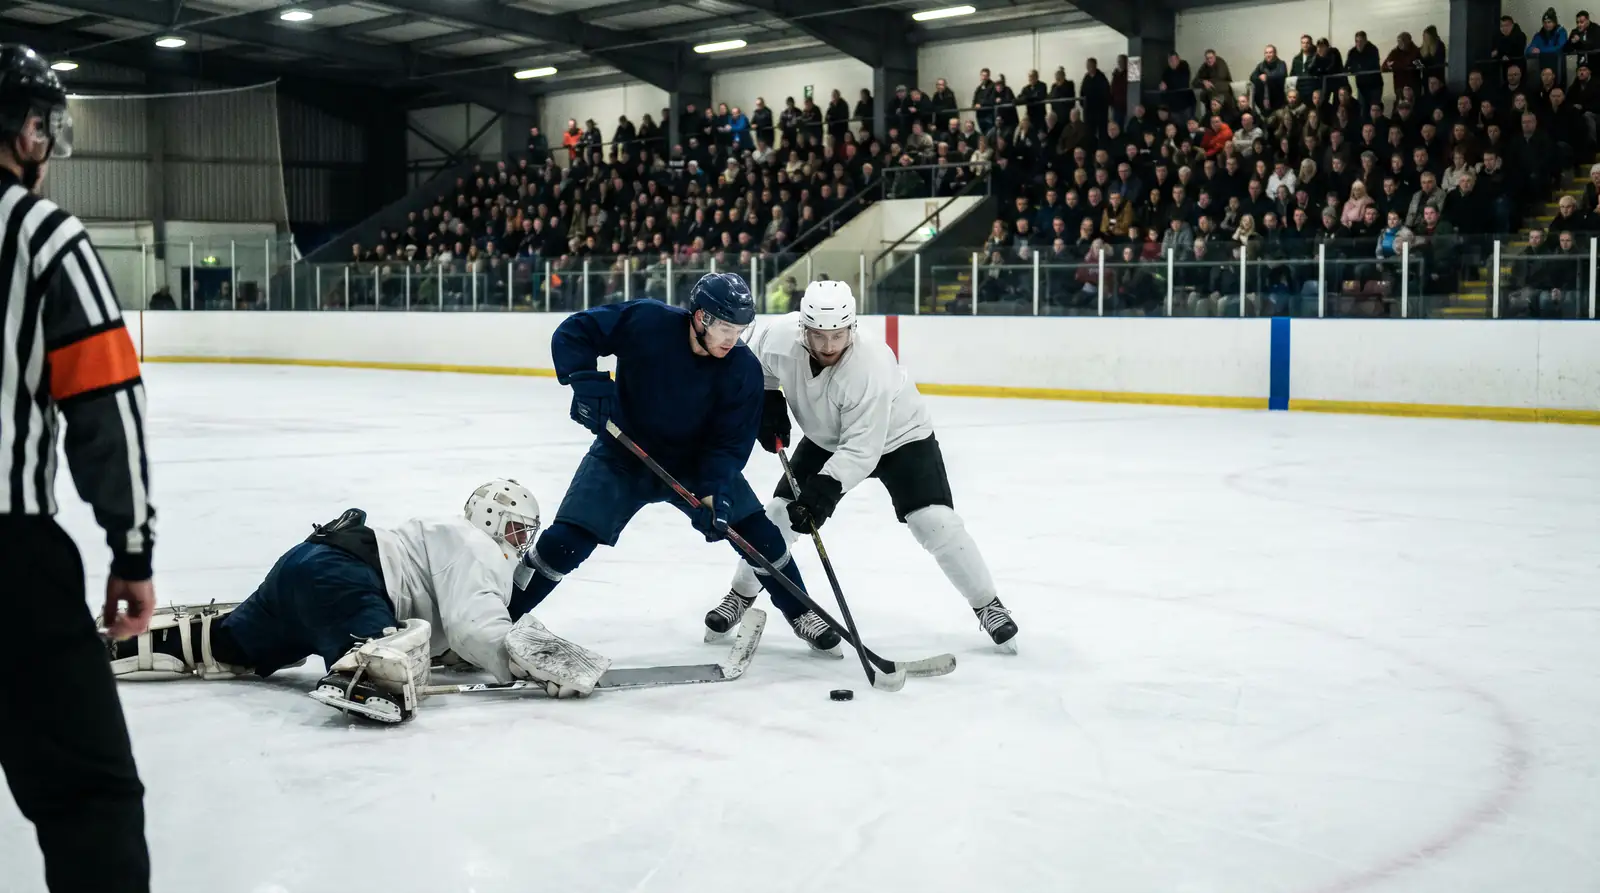
That said, EIHL teams travelling between weekend games — for example a Belfast trip to Sheffield and then Manchester — still underperform on the second night. The effect is roughly half the NHL magnitude, but it’s measurable, and the EIHL market doesn’t always price it. If you follow the EIHL closely, the back-to-back second-leg underdog is a reasonable value spot a handful of times per season.
The deeper question of who’s actually in net
Every B2B angle ultimately reduces to a question about the goalie matchup. Knowing which team is on the second leg tells you the game is tilted; knowing which goalie is starting tells you by how much. The full unpacking of goalie metrics and how to read the matchup is in our NHL goalie matchup guide.

Articles
Prepared by the hockeybetonline.com editorial staff.
